Analyzing economic activities is bifurcated between the pre-and-post-pandemic eras. The devastating effects of Covid-19 restrictions fell upon every economic contributor globally; however, the most affected sectors were airlines and tourism, real estate, and transportation (shipping).
Italy’s real estate was no exception either. However, despite the recession in the economy due to the covid-19 pandemic Italy’s housing prices remained stable, and in some brief instances even rose by 1.6%. In Rome, the country’s capital the average price for a house lurked around EUR 3,000 per sq.m.
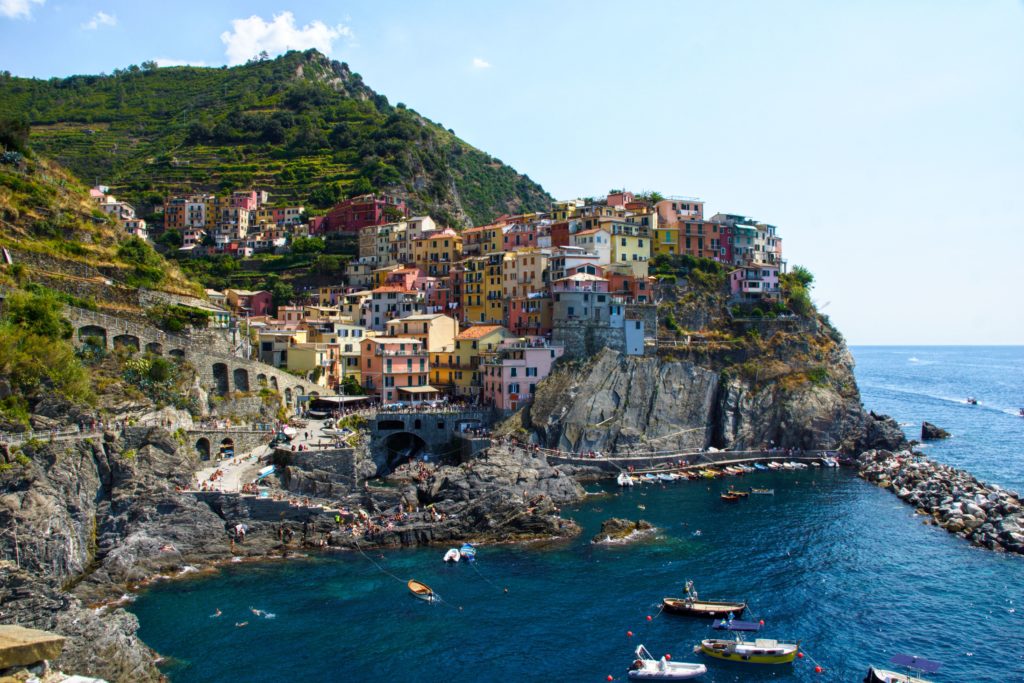
In the current market Milan and Venice have the highest cost per sq.m in the country; averaging between EUR 4,000 – 4,500 respectively. Besides the major cities mentioned the Italian real estate sector at large, suffered major damages, as it was the first western country to impose a national lockdown, and lost more than 100000 lives.
The decline in prices in the past
It is prudent to keep an eye on the rear while investing in the future. Italy’s housing had a period in time where the decline in prices has not been recovered yet. The first half of 2008 witnessed a growth of 80% in the prices of houses, while in the second half of the same year the prices started to decline, and unlike other EU states, Italy’s comeback is still in process.
Furthermore, prices kept on decreasing from 2008 onwards till 2011 at an average of 2% per annum (adjusted for inflation). Unfortunately, the drop continued further, more rapidly between 2011 till 2014 when the rate of decline was recorded at 13.5-14%. The market shifted to recovery mode in 2015 and steadily gained some lost points before the market was struck by the pandemic restrictions once again. In the last quarter of 2020 prices once again gained stability, however, the overall decline was recorded at 3%.
Variations in house prices
Many factors determine the cost of ownership and rental of any property; primarily the variation is a function of location, construction quality, type of accommodation, the age of the property, etc.
The below table projects the variation in average prices per sq.m in different cities of Italy in descending order price-wise:
| S.no. | City | Cost/sq.m. in US$ | Percentage change from the previous year |
| 1. | Venice | 5.500 | -0.7% |
| 2. | Florence | 4,800 | -0.4% |
| 3. | Milan | 4,700 | 11.8% |
| 4. | Bologna | 3,700 | +0.7% |
| 5. | Rome | 3,000 | +0.6% |
| 6. | Naples | 2,700 | -5.3% |
| 7. | Turin | 2,000 | +2.3% |
| 8. | Genoa | 1,700 | -3.4% |
| 9. | Catania | 1,500 | -4.7% |
| 10. | Palermo | 1,500 | -5.5% |
Shifting demands
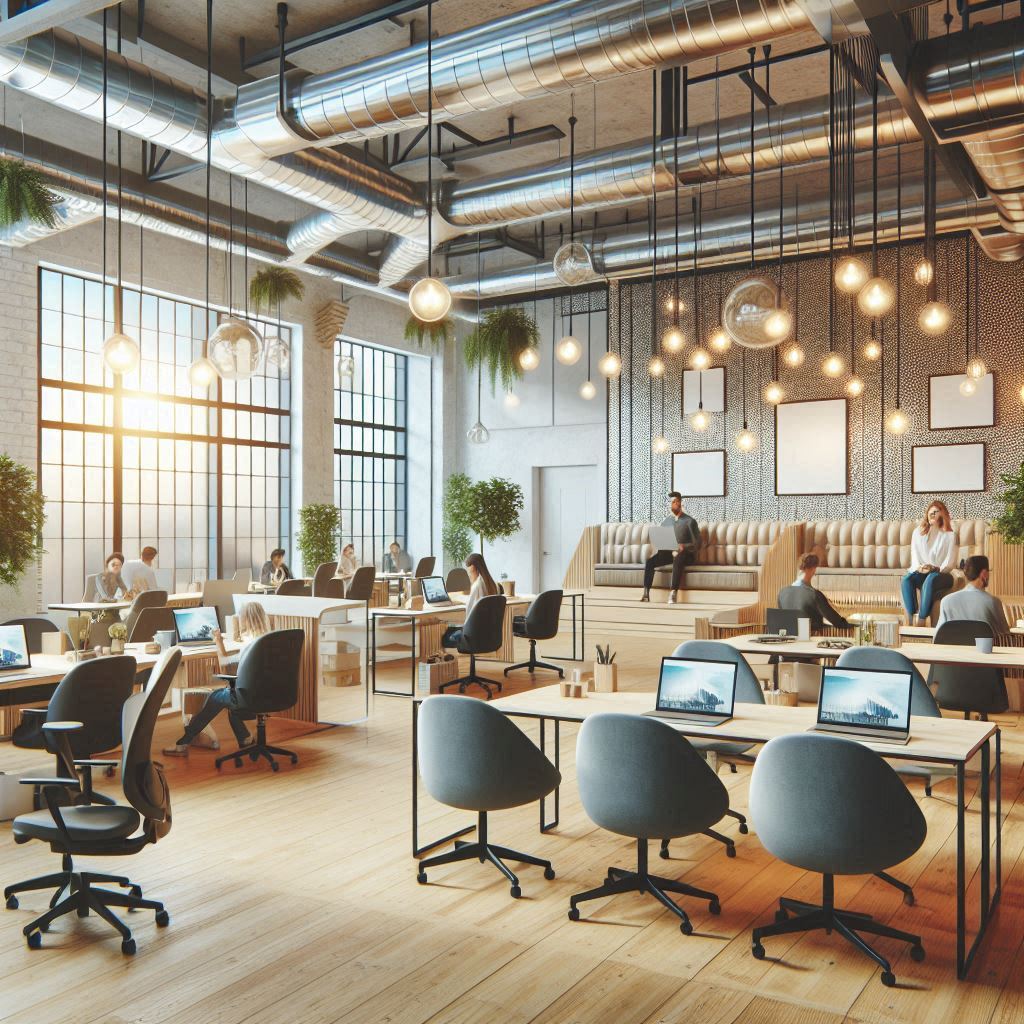
Properties can be divided into two main categories; residential and commercial. While the ownership trend is seen more in residential properties for living and renting purposes, commercial properties are largely taken on a rental basis. As owning a commercial property may not be financially viable from the investor’s and business’s point of view. The money spent in owning a commercial can be put to good use if the same is invested in saleable goods and services.
Milan led the commercial price race in 2020-21, averaging a 1% increase in the mentioned period. Prime locations and upscale areas of Milan witnessed an increase of 1.5% where an office space or shop may cost between EUR 500-600 per sq.m/month. On the other hand, the return for investors on rental properties has increased by 5% for the fourth year consecutively.
The average percentage change in rental properties is projected in the table below:
| S.no. | Location | Percentage change |
| 1. | Milan | +0.8% |
| 2. | Venice | +0.2% |
| 3. | Florence | +0.1% |
While the expected return on investment in the shape of rentals is displayed in the following table:
| S.no. | Location | Percentage change |
| 1. | Rome | +7.1% |
| 2. | Venice | +7.0% |
| 3. | Florence | +6.7% |
The demand for rental commercial places, especially shops, has increased post-pandemic. As the traveling restrictions lifted, Italy hosted a large number of tourists who had postponed their trips due to the lockdown. Office and logistic spaces such as parking lots, garages, workshops, etc. have also been in demand lately.