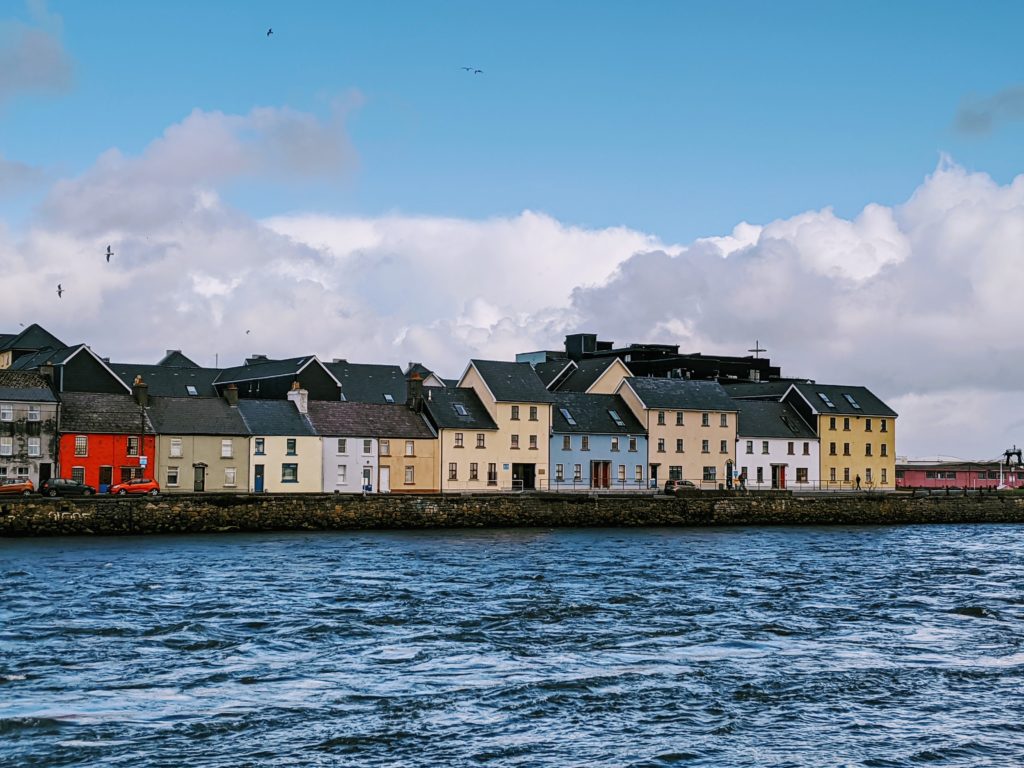
After the coronavirus pandemic, the real estate economy of Ireland has rapidly gained momentum; especially the housing sector, which is hovering at the same index point as during the ‘Celtic Tiger’ years (1996-2007). The prices recorded 164 points on the index as of June 2022 – the same as during the 2007 property boom.

The rise in property in various cities is shown in the table below:
| Location | Median prices (Euros) |
| Dublin | 290,000 |
| Dun Laoghaire-Rathdown | 605,000 |
| Longford | 140,000 |
| South Dublin | 375,000 |
The prices of new houses, be it apartments or single-family homes, have risen by 16% in 2022; border towns and counties such as Cavan, Donegal, Leitrim, Monaghan, and Sigo experienced a 20% increase while the Midwest region recorded an increase by 12%.
The buying trend was similar between investors and end-users (dwellers) and a total sale of new houses was recorded at 50,000 units till the end of June 2022. The price increase in ownership of property naturally propels the rental values as well. The table below displays variations in rents for different cities and areas in Ireland.
| City/Town/County | Accommodation | Avg rent (Euros) |
| Dublin | 1 bedroom apartment | 1,800 |
| Dublin | 3 bedrooms apartment | 3,198 |
| Cork | 1 bedroom apartment | 1,500 |
| Cork | 3 bedrooms apartment | 2,500 |
| Derry | 1 bedroom apartment | 600 |
| Derry | 3 bedrooms apartment | 800 |
Reasons for rising prices
Studies suggest that the primary contributor to the recent price hike is a limited supply. This lack of supply pushed the prices of houses and residential units to increase by 88% compared to 2018-19. Another reason for the increase in prices in the real estate sector is said to be the significant decrease in the rate of interest. The Central Bank of Ireland took a wise decision to lower the interest rates during the pandemic; a decision which attracted long-term investors largely and to some extent the end users alike.
Lastly, the growth in the Irish economy in 2020 was recorded at 3%. The positive growth came at a time when the rest of the EU states and the world’s economy at large were trending negatively. The growth pattern continues and is projected at 4% growth till the end of 2022.
The pattern of growth in Irish housing sector prices
The pattern along which the Irish housing sector has moved has been cyclic; each downturn is followed by an upheaval. During the ‘Celtic Tiger’ years the housing sector experienced a mega boom in prices of old and new houses; approximately 390% and 290% respectively.
This upward momentum continued till 2007, for almost 10 years. In 2008, the pattern shifted and Ireland witnessed the biggest slump in Europe’s modern history, almost 60% annually from its peak. Eventually, the pattern once again started climbing from 2013; 6.5% in the first year, 16% in 2014, and a stable 7% growth in the years to follow.
Looking at the past increase and plunge in prices, the investors were anxious about the stability of the market. The Central Bank played its role by singlehandedly acquiring 80% of house loans floating in the market, and later decreasing the rate of interest, and increasing the payback time. The Central Bank’s maneuver proved to be a win-win for all stakeholders.
Hindrances in homebuilding
The restrictions put in place due to Covid-19 were multidimensional; such as travel bans, social gatherings, restricted working hours, etc. affected the development sector too. On one hand development on the pending construction sites dropped by 3% (25,000 units), while on the other hand, the issuance of permits for new construction work was reduced by almost 15%. A 15% decrease translates to 10,000 units that were demanded by the market but couldn’t be put into the supply chain of the economy.
During the booming years, the completion of new units (houses, apartments, condos, etc.) soared to 90,000 in 2006 and dropped by more than 60% by the end of 2011 to a mere 11,000 units. At the lowest point in the downward slide, the total number of completed units reached 8,000 units in 2014.


